Category: Monitoring

  • A Four Node Kubernetes Cluster for Your Home Lab

    A Four Node Kubernetes Cluster for Your Home Lab

    Introduction

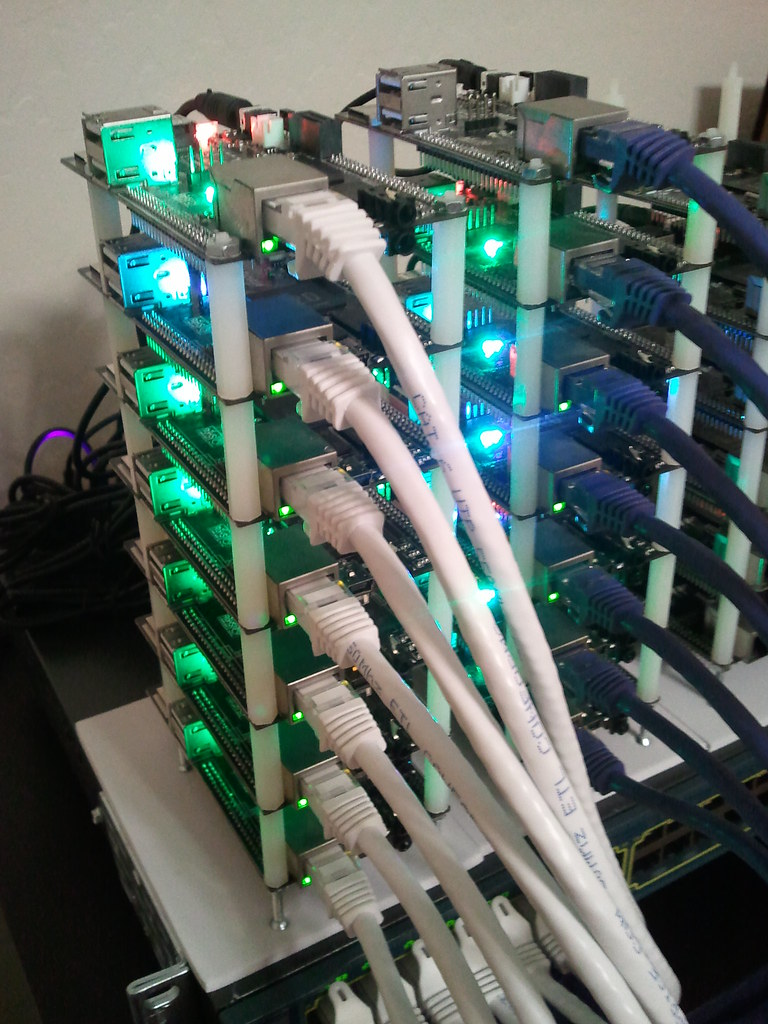
    While I have this on my mind, I decided to build a microk8s cluster from a bunch of raspberry pis that I have laying around. Why? In practice more useful than minikube which is also great for local development.

    What we will be using

    1. Ubuntu 22.04.03 Linux distribution
      • 32 bit for contro pi 3b armhf
      • 64 bit for 4 arm64
    2. Ansible
    3. microk8s
    4. prometheus, grafana, node_exporter

    Using five raspberry pi’s. One for an Ansible control to deploy software and four for our microk8s cluster

    Hardware Setup

    IP Allocation

    I added address reservations on my router to automatically assign an IP to a known MAC address on a Raspberry pi. This ensures that the pi will have the same IP address each time it boots. No messing with the network configuration in the operating system every time I re-install the OS. Since this is technically a test environment where I will burn-and-build at will. I will not go through this excercise as there ae many ways to do this on a DHCP server.

    To obtain the MAC aaddress, I first installed an OS on the pi and noted down the MAC.

    OS Installation

    Use raspberry pi imager. You can download the softwaere here https://www.raspberrypi.com/software/

    Ansible

    for automation

    Copy Ansible keys to other hosts from cloudletcmd

    ssh-copy-id -i ansible_rsa.pub pi@192.168.1.200
    ssh-copy-id -i ansible_rsa.pub pi@192.168.1.201
    ssh-copy-id -i ansible_rsa.pub pi@192.168.1.202
    ssh-copy-id -i ansible_rsa.pub pi@192.168.1.203

    ansible-playbook update.yml –ask-become-pass
    ansible all -m ping

    For microk8s

    sudo nano /boot/firmware/cmdline.txt

    add the following to the file
    cgroup_enable=memory cgroup_memory=1

    then reboot
    sudo reboot

    MicroK8s

    sudo snap install microk8s --classic
    sudo apt install linux-modules-extra-raspi
    sudo microk8s stop; sudo microk8s start

    sudo microk8s.add-node <- have to run for each node

    From the node you wish to join to this cluster, run the following:
    microk8s join 192.168.1.200:25000/cfd6f5addae6e0959a4c7f1de1f47a47/583d9c2f5994

    Use the ‘–worker‘ flag to join a node as a worker not running the control plane, eg:
    microk8s join 192.168.1.200:25000/cfd6f5addae6e0959a4c7f1de1f47a47/583d9c2f5994 --worker

    If the node you are adding is not reachable through the default interface you can use one of the following:
    microk8s join 192.168.1.200:25000/cfd6f5addae6e0959a4c7f1de1f47a47/583d9c2f5994

    192.168.1.200 cloudlet01
    192.168.1.201 cloudlet02
    192.168.1.202 cloudlet03
    192.168.1.203 cloudlet04

    microk8s join 192.168.1.200:25000/0c4812f17a41a0a6c9e0a931d263d0eb/583d9c2f5994
    microk8s enable ha-cluster on main node

    kube config

    to add to .kube/config run sudo microk8s config and add output to config.

    sudo usermod -a -G microk8s pi

    Prometheus

    Set up

    Manually setting up Prometheus node exporter

    sudo groupadd --system prometheus
    sudo useradd -s /sbin/nologin --system -g prometheus prometheus
    sudo apt update
    sudo apt -y install wget curl vim
    sudo apt autoremove
    curl -s https://api.github.com/repos/prometheus/node_exporter/releases/latest | grep browser_download_url | grep linux-arm64 | cut -d '"' -f 4 | wget -qi -
    tar xvf node_exporter-1.5.0.linux-armv7.tar.gz
    cd node_exporter-1.5.0.linux-armv7/
    sudo mv node_exporter /usr/local/bin
    node_exporter --version

    A basic service config for node_exporter:
    sudo vim /etc/systemd/system/node_exporter.service

    [Unit]
    Description=Prometheus
    Documentation=https://github.com/prometheus/node_exporter
    Wants=network-online.target
    After=network-online.target

    [Service]
    Type=simple
    User=prometheus
    Group=prometheus
    ExecReload=/bin/kill -HUP $MAINPID
    ExecStart=/usr/local/bin/node_exporter \
    --collector.cpu \
    --collector.diskstats \
    --collector.filesystem \
    --collector.loadavg \
    --collector.meminfo \
    --collector.filefd \
    --collector.netdev \
    --collector.stat \
    --collector.netstat \
    --collector.systemd \
    --collector.uname \
    --collector.vmstat \
    --collector.time \
    --collector.mdadm \
    --collector.zfs \
    --collector.tcpstat \
    --collector.bonding \
    --collector.hwmon \
    --collector.arp \
    --web.listen-address=:9100 \
    --web.telemetry-path="/metrics"

    [Install]
    WantedBy=multi-user.target

    sudo systemctl daemon-reload; sudo systemctl start node_exporter; sudo systemctl enable node_exporter; sudo systemctl status node_exporter

    Remove microk8s

    sudo microk8s reset

    sudo snap remove microk8s

    Resources

    https://microk8s.io/docs/install-raspberry-pi

  • Icinga Monitoring System

    After many installations of Icinga, I finally decided to cobble together the documentation that I use and add it to a central location. Links to the original documents are found throughout this post. This document provides instructions on setting up the Icinga monitoring system. It will go over the following:

    • Icinga and IDOUtils
    • Icinga Web
    • PNP4Nagios
    • Icinga Mobile

    Pre-Requisites

    • Ubuntu Server 14.04 LTS 64 Bit
    • 2GB RAM
    • 2 CPU
    • 60 GB HDD

    Icinga and IDOUtils

    The installation of the following software will be covered in this section:

    • Icinga Core
    • Icinga Classic UI (the “CGIs”)
    • Icinga IDOUtils
      • Mysql or Postgresql as database
    • Icinga Docs

    Icinga Core

    This document describes the procedure for installing Icinga core using the official packages. There is also documentation for installing the package maintainer version (PPA) which may be more up to date.

    The following command will install all required packages:

    sudo apt-get install icinga icinga-doc icinga-idoutils mysql-server libdbd-mysql mysql-client

    This installation will use MySQL as the database server. Postgress can also be used, but will not be covered in this document.

    Plugins

    The following command will install the Nagios plugins.

    sudo apt-get install nagios-plugins

    Configuration

    Enable IDO2DB

    Edit the following file:

    /etc/default/icinga

    change the following line:

    IDO2DB=no

    to

    IDO2DB=yes

    Then restart the ido2db service:

    sudo service ido2db start

    check to see if it is enabled on startup:

    sh -x /etc/init.d/ido2db start | grep IDO2DB


    Enable IDOMOD

    Copy the example configuration file into the Icinga configuration directory:

    sudo cp /usr/share/doc/icinga-idoutils/examples/idoutils.cfg-sample /etc/icinga/modules/idoutils.cfg

    Restart Icinga with:

    sudo service icinga restart

    Check the logfile (/var/log/icinga/icinga.log) to see if the module has been loaded and connected to IDO2DB:

    [1399482608] idomod: IDOMOD 1.10.3 (02-11-2014) Copyright(c) 2005-2008 Ethan Galstad, Copyright(c) 2009-2013 Icinga Development Team (https://www.icinga.org)
    [1399482608] idomod: Successfully connected to data sink. 0 queued items to flush.
    [1399482608] Event broker module 'IDOMOD' version '1.10.3' from '/usr/lib/icinga/idomod.so' initialized successfully.

    Enable External Commands

    This may have been enabled during the package installation. To check, do the following:

    See if:

    check_external_commands=1

    exists in /etc/icinga/icinga.cfg

    If it is set to 0, change it to 1 as above and do the following:

    sudo service icinga stop
    sudo dpkg-statoverride --update --add nagios www-data 2710 /var/lib/icinga/rw
    sudo dpkg-statoverride --update --add nagios nagios 751 /var/lib/icinga
    sudo service icinga start

    Classic UI Authentication

    Users can be added to access the portal with the following command:

    sudo htpasswd /etc/icinga/htpasswd.users <username>

    PNP4Nagios

    PNP is an addon for the Nagios Network Monitoring System. PNP provides easy to use, easy to configure RRDTools based performance charts feeded by the performance data output of the Nagios Plugins.” – http://docs.pnp4nagios.org/pnp-0.6/start

    This document covers installing PNP for Icinga.

    Requirements

    • Icinga running
    • Icinga Classic UI or Icinga Web running

    Setup

    First, ensure the system is up to date with:

    sudo apt-get update

    Then install the pnp4nagios package:

    sudo apt-get install --no-install-recommends pnp4nagios

    without –no-install-recommends, icinga will be installed as a dependancy if not already installed. Icinga installation was covered in the previous section.

    Enable RRDCached in PNP4Nagios

    “rrdcached is a daemon that receives updates to existing RRD files, accumulates them and, if enough have been received or a defined time has passed, writes the updates to the RRD file. A flush command may be used to force writing of values to disk, so that graphing facilities and similar can work with up-to-date data.” – http://oss.oetiker.ch/rrdtool/doc/rrdcached.en.html

    General purpose – decrease I/O, increase performance.

    Installation

    Install the software with the following command:

    sudo apt-get install rrdcached

    Now, add it to system init:

    sudo update-rc.d rrdcached defaults

    RRDCACHED Configuration

    Create the cache directory:

    sudo mkdir -p /var/cache/rrdcached

    Add the nagios user to the www-data group with:

    sudo usermod -aG www-data nagios

    Now the nagios user account can write to web directories.

    Edit the configuration file, /etc/default/rrcached and add the following line:

    OPTS="-w 1800 -z 1800 -j /var/cache/rrdcached -s nagios -m 0660 -l unix:/var/run/rrdcached.sock"

    Now, restart the service:

    sudo service rrdcached restart

    PNP4Nagios Configuration for RRDCACHED

    Add the following line to /etc/pnp4nagios/process_perfdata.cfg

    RRD_DAEMON_OPTS = unix:/var/run/rrdcached.sock

    Then modify the following line in /etc/pnp4nagios/config.php

    $conf['RRD_DAEMON_OPTS'] = 'unix:/var/run/rrdcached.sock';

    Also, change the nagios_base  in config.php to the following:

    $conf[‘nagios_base’] = “/cgi-bin/icinga”;

    Restart Services

    sudo service rrdcached restart

    and

    sudo service apache2 restart

    Enable PNP4Nagios in Icinga

    Configuration

    Add performance data in icinga.cfg. Edit /etc/icinga/icinga.cfg and add the following lines:

    # performance data
    process_performance_data=1
    
    service_perfdata_file_template=DATATYPE::SERVICEPERFDATA\tTIMET::$TIMET$\tHOSTNAME::$HOSTNAME$\tSERVICEDESC::$SERVICEDESC$\tSERVICEPERFDATA::$SERVICEPERFDATA$\tSERVICECHECKCOMMAND::$SERVICECHECKCOMMAND$\tHOSTSTATE::$HOSTSTATE$\tHOSTSTATETYPE::$HOSTSTATETYPE$\tSERVICESTATE::$SERVICESTATE$\tSERVICESTATETYPE::$SERVICESTATETYPE$
    
    host_perfdata_file_template=DATATYPE::HOSTPERFDATA\tTIMET::$TIMET$\tHOSTNAME::$HOSTNAME$\tHOSTPERFDATA::$HOSTPERFDATA$\tHOSTCHECKCOMMAND::$HOSTCHECKCOMMAND$\tHOSTSTATE::$HOSTSTATE$\tHOSTSTATETYPE::$HOSTSTATETYPE$
    
    service_perfdata_file_mode=a
    host_perfdata_file_mode=a
    
    service_perfdata_file_processing_interval=30
    host_perfdata_file_processing_interval=30
    
    service_perfdata_file=/var/spool/pnp4nagios/nagios/service-perfdata
    host_perfdata_file=/var/spool/pnp4nagios/nagios/host-perfdata
    
    service_perfdata_file_processing_command=pnp-bulknpcd-service
    host_perfdata_file_processing_command=pnp-bulknpcd-host

    Add commands to /etc/icinga/commands.cfg:

    # pnp4nagios
    define command{
            command_name    pnp-bulknpcd-service
            command_line    /bin/mv /var/spool/pnp4nagios/nagios/service-perfdata /var/spool/pnp4nagios/npcd/service-perfdata.$TIMET$
    }
    
    define command{
            command_name    pnp-bulknpcd-host
            command_line    /bin/mv /var/spool/pnp4nagios/nagios/host-perfdata /var/spool/pnp4nagios/npcd/host-perfdata.$TIMET$
    }

    Web Configuration

    Edit the /etc/apache2/conf-available/pnp4nagios.conf file and change to the following:

            AuthName "Icinga Access"
            AuthType Basic
            AuthUserFile /etc/icinga/htpasswd.users

    Then restart apache with service apache2 reload.

    Enable NPCD

    Edit /etc/default/npcd and edit the fllowin gline to look like:

    Run="yes"

    Then restart the service with:

    sudo service npcd start

    Integration Into Icinga

    Create the file /etc/icinga/objects/pnptemplates.cfg

    define host {
            name       pnp-hst
            register   0
            action_url /pnp4nagios/graph?host=$HOSTNAME$' class='tips' rel='/pnp4nagios/popup?host=$HOSTNAME$&srv=_HOST_
    }
    
    define service {
            name       pnp-svc
            register   0
            action_url /pnp4nagios/graph?host=$HOSTNAME$&srv=$SERVICEDESC$' class='tips' rel='/pnp4nagios/popup?host=$HOSTNAME$&srv=$SERVICEDESC$
    }

    Then use them in host and service configurations:

    define host{
            name                            generic-host
            use                             pnp-hst
    ...
    
    define service{
            name                            generic-service
            use                             pnp-svc
    ...

    Copy the ssi file to the web UI:

    sudo cp /usr/share/doc/pnp4nagios/examples/ssi/status-header.ssi /usr/share/icinga/htdocs/ssi/status-header.ssi
    sudo chmod 644 /usr/share/icinga/htdocs/ssi/status-header.ssi

    then reload icinga for the changes to take effect:

    sudo service icinga reload
  • Zenoss

    I think I might try Zenoss again. It has been a year or two since I last visited this product. I am looking for a product that is all encompassing. I will probably use CentoOS as the OS.

    http://wiki.zenoss.org/Install_Zenoss